The commonly used forecast typically predicts the weather from today up to 10 days ahead. This is the forecast you see on the news or check on yr.no before you head out the door. In the context of climate change, on the other hand, one usually work with periods of a hundred years and compare how the earth’s climate will be at the turn of the century. Climate Futures produces forecasts that are somewhere in between, namely long-term forecasts on a range from 10 days to 10 years into the future. In this article, we explain how we do this, and how our forecasts differ from the ones you use in your everyday life.
Long-term forecasts
We typically divide long-term forecasts into two categories: seasonal forecasts and monthly forecasts. Seasonal forecasts are issued once a month, typically for a month ahead, and thus risk losing their relevance if something unexpected happens in the period between the forecasts. Nevertheless, Climate Futures mostly uses seasonal forecasts, and the monthly forecasts (ca. 2-4 weeks ahead) that are published fortnightly are used to update the seasonal forecast, which is important for the forecasts to be useful.
So how do we actually create these long-term forecasts? The short explanation is that we use a bunch of models that simulate the atmosphere, put in data from today, and the model calculates how the atmosphere, and therefore also the weather, will be like at a given point in time in the future. These models are built on physical equations, just like the ones used for standard weather forecasting.
The slightly longer explanation is about statistics and probability. We make predictions based on models that we get from several centres around the world: ECMWF in Europe, Met Office in the UK, CMCC in Italy, Météo France in France, and DWD in Germany. The models we use are computer programs that calculate weather development based on certain initial conditions. These are made by physical equations that describe the weather. Furthermore, we compare the result to the average we have based on historical data from the past 30 years. If, for example, 70% of the simulations indicate a temperature over the historical average, it is likely that the month in question will be warmer than normal.
Weather forecasts become more uncertain the longer into the future you predict because of the butterfly effect. In short, this theory states that small changes can have great consequences. Hence, the more simulations we have, the more alternative branches we get because every little change creates an alternative scenario. We have many weather stations, but not everywhere, and thus we do not have an exact snapshot of today’s weather, which, as mentioned, is what we use as a starting point for our models (initial conditions). If we, for example, measure 20 degrees, we can create simulations with temperatures of 20, 20.0001, 20.0002 etc. Because of the butterfly effect, these tiny margins can have a long-term effect that we want to use in our forecast.
Our information is not complete, and thus we compensate by creating simulations with slightly different initial conditions. This gives us a better picture of possible future weather scenarios. The initial conditions are often data from the month before, i.e., the forecast from October is based on data from 1 September. We feed the models with these data and then look at how many of the simulations that point in the same direction so that we can issue a forecast that tells us the probability of a specific scenario.
Seasonal forecasts show the probability of different scenarios
Our forecasts are probability forecasts. We use a reference period from 1993 to 2020 and look at the temperature in a specific month. We divide the possible outcomes for the month into two categories, which are in theory equally likely: colder than normal and warmer than normal. We do the same for precipitation, dividing the outcomes into drier than normal and wetter than normal.
If, for example, 50 of the 51 simulations that ECMWF create says that October 2021 will be drier than normal, that is a pretty good indication. However, if it was only 10 out of 51, that would not be a very strong indication of that happening.
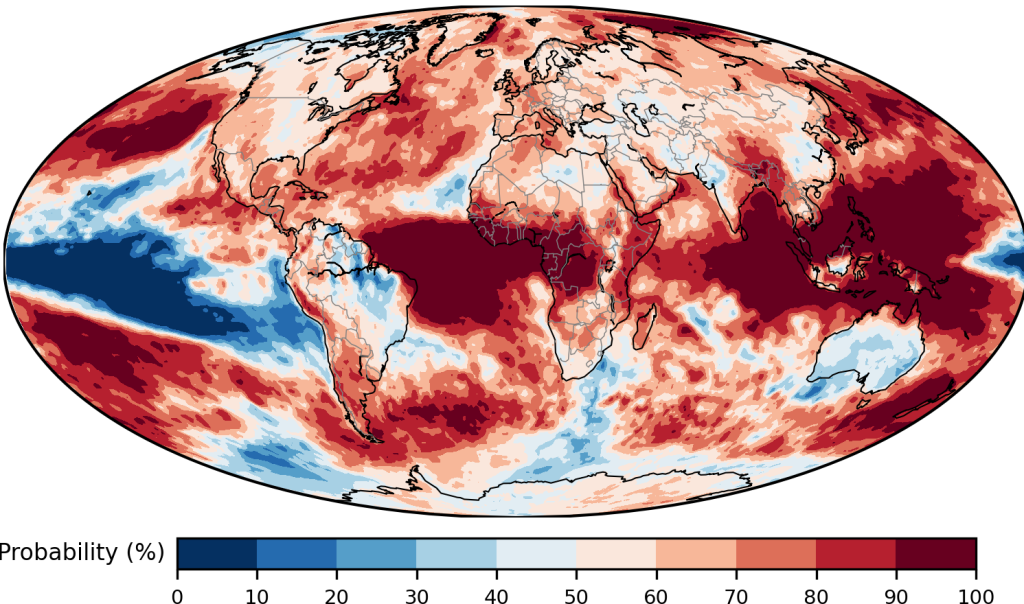
In theory, there is a 50% chance for both a warmer and colder than normal scenario, but because of climate change, both Norway and the rest of the world is becoming warmer. Consequently, the probability of a warmer than normal scenario is higher than 50%, and we see that the average is actually at 65%. This means that over 65% of the simulations need to indicate warmer than normal for us to interpret the month as likely to become warmer than it has been on average the past 30 years.
Example: forecast for October 2021
Climate Futures recently published the seasonal forecast for October 2021, and we can use this to exemplify how we present our forecasts, and how they can be interpreted. We start by looking at the probability of October falling under the category warmer than normal.
As shown by the figure above, the global average is 65% instead of 50%, which is what it would be with no global warming. In the Pacific area, the likelihood of a warmer than normal October is especially low. This is due to an ongoing La Niña in the region, a longer period of colder sea temperatures than normal. At the other end of the scale, we find for example West Africa and Indonesia, where there is a very high chance that October will be warmer than usual.
The figure shows that the likelihood of October being warmer than normal in Norway is between 50 and 60%. As mentioned, this means that it is not likely that October will be warmer than one can expect in an increasingly warmer world (i.e., the average of 65% chance for warmer than normal).
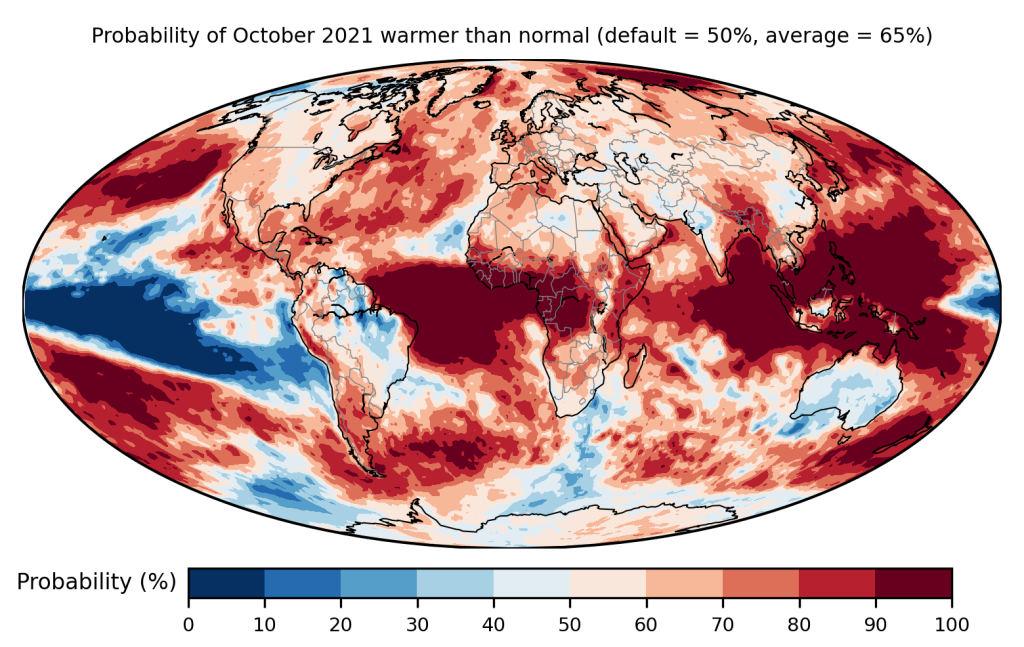
Finally, we will look at the probability of an October that is wetter than normal.
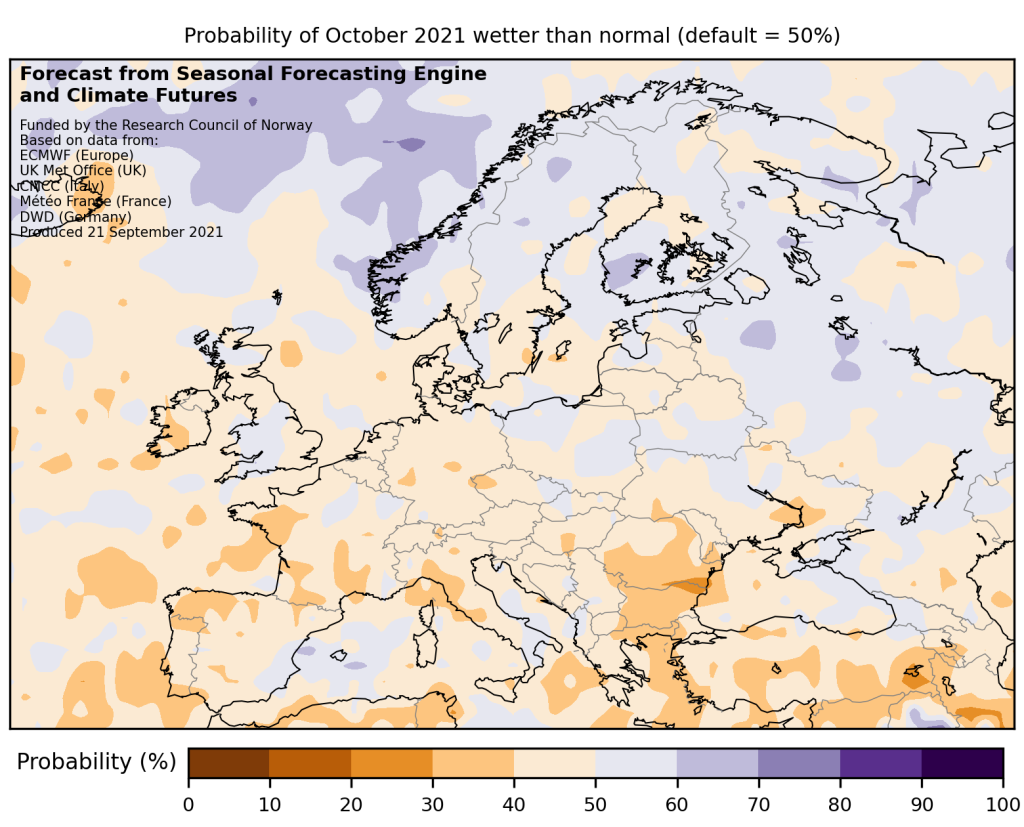
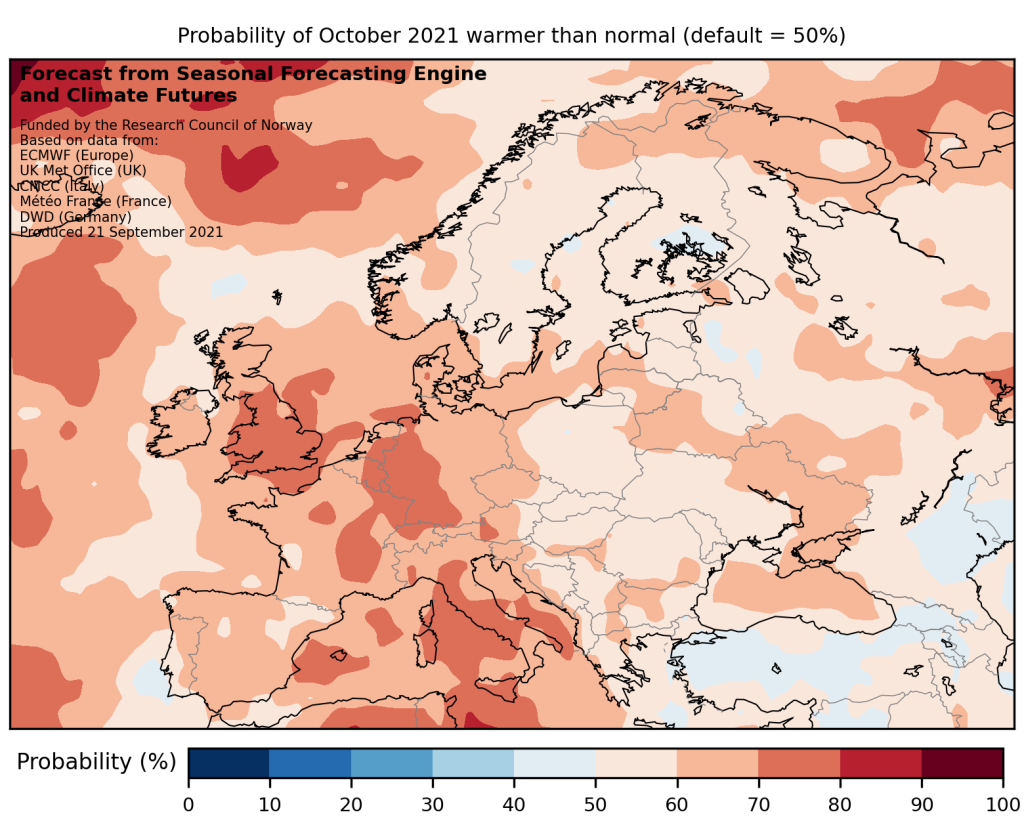
According to the figure, the probability of a wetter than normal October varies a bit, but it lies somewhere between 50 and 70%, with the western part of Norway having the highest chance of a wetter October than usual. We are not yet seeing a clear trend that the global precipitation is changing the way we do with temperature, so here the average is still 50% for the time being. Thus, it is more likely that October will be wetter than normal than drier than normal.